PostgreSQL Query Execution Plan Analysis: Identifying and Fixing the Hidden Killers of Database Performance
When a PostgreSQL database begins slowing down in production, the symptoms are often easy to spot. Application response times increase, API requests start timing out, dashboards become sluggish, and users begin reporting delays. What is not always obvious is the real cause behind the degradation.
In many organizations, the initial response focuses on increasing CPU resources, adding memory, or scaling infrastructure. While these actions may provide temporary relief, they rarely address the underlying problem. More often than not, performance issues originate from inefficient query execution plans.
Over the years, database teams have repeatedly encountered situations where a single poorly optimized query consumed excessive resources, affected concurrent workloads, and created widespread performance bottlenecks across business-critical systems. In these cases, the root cause was not hardware limitations but execution plan decisions made by the PostgreSQL query planner.
Understanding PostgreSQL Query Execution Plan Analysis is one of the most valuable skills for database administrators, architects, and engineering teams responsible for maintaining production systems. It provides visibility into how PostgreSQL executes SQL statements, where resources are being consumed, and why certain queries perform significantly worse than expected.
This guide explores the most common execution plan bottlenecks found in production environments, how to identify them, and practical approaches for resolving them before they impact business operations.
Why PostgreSQL Query Execution Plan Matter
Every SQL query submitted to PostgreSQL goes through a planning process before execution begins.
The PostgreSQL planner evaluates multiple possible strategies and selects what it believes is the most efficient execution path. This decision is based on several factors including:
Table size
Available indexes
Column statistics
Estimated row counts
Join conditions
Data distribution
The chosen execution plan determines how PostgreSQL retrieves, filters, joins, sorts, and aggregates data.
When the planner chooses correctly, queries complete quickly and consume minimal resources.
When the planner makes inaccurate assumptions, execution times can increase dramatically.
A query expected to process a few hundred rows may end up scanning millions of records. A join intended to run in milliseconds can consume CPU resources for several minutes. These situations are common causes of production incidents.
This is why PostgreSQL Query Execution Plan Analysis remains one of the most effective approaches for diagnosing performance problems.
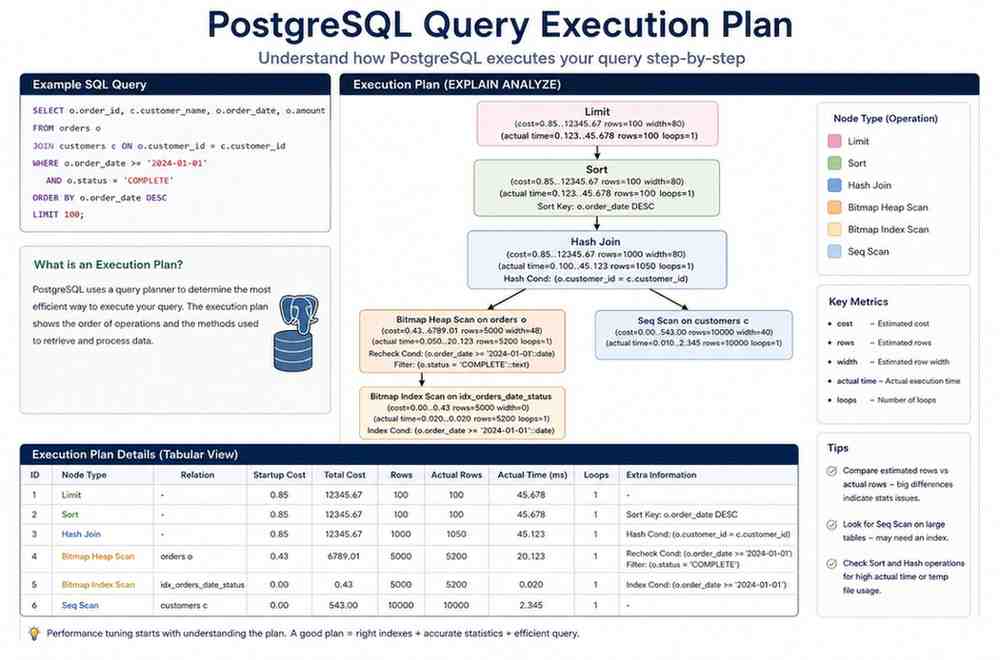
Understanding EXPLAIN and EXPLAIN ANALYZE
The starting point for every performance investigation is understanding the execution plan.
PostgreSQL provides two primary commands:
EXPLAIN
and
EXPLAIN ANALYZE
EXPLAIN shows the planner’s estimated execution strategy.
EXPLAIN ANALYZE executes the query and reports actual runtime statistics.
Consider a simple example:
EXPLAIN ANALYZE
SELECT *
FROM orders
WHERE customer_id = 101;
The output reveals:
Estimated rows
Actual rows returned
Execution method
Time spent at each operation
Cost estimates
Loop counts
The most valuable insight comes from comparing estimated rows versus actual rows.
When these values differ significantly, planner statistics are often inaccurate, leading to poor execution choices.
Many production tuning engagements begin by identifying these estimation errors.
PostgreSQL EXPLAIN documentation
Hidden Killer #1: Sequential Scans on Large Tables
One of the most common causes of PostgreSQL performance degradation is unnecessary sequential scanning.
A sequential scan occurs when PostgreSQL reads every row in a table to find matching records.
For small tables, this behavior is often acceptable.
For tables containing millions of rows, it can be disastrous.
Consider the following query:
SELECT *
FROM transactions
WHERE transaction_status = 'FAILED';
Without an appropriate index, PostgreSQL may scan the entire table.
In a production system containing hundreds of millions of transaction records, this can result in:
High disk I/O
Increased CPU utilization
Buffer cache pressure
Longer query response times
Application slowdowns
PostgreSQL Query Execution Plan typically display:
Seq Scan on transactions
This indicates PostgreSQL is reading the entire table.
Real-World Scenario
A financial services platform experienced periodic performance degradation during business hours.
Investigation revealed a reporting query executing every five minutes.
Although the query returned only a few thousand rows, PostgreSQL performed a full scan across a table containing over 180 million records.
The query consumed significant I/O bandwidth and affected unrelated workloads.
Adding a properly designed index reduced execution time from several minutes to less than one second.
The infrastructure remained unchanged. Only the PostgreSQL Query Execution Plan improved.
PostgreSQL indexing strategies
How to Identify Problematic Sequential Scans
Not every sequential scan is problematic.
Focus on scans involving:
Large tables
Frequently executed queries
High-cost operations
Business-critical workloads
Useful monitoring indicators include:
High shared buffer reads
Elevated disk activity
Long-running queries
CPU spikes during reporting jobs
PostgreSQL Query Execution Plan often reveal whether PostgreSQL is choosing sequential scans due to missing indexes or inaccurate planner estimates.
When sequential scans repeatedly appear in critical workloads, deeper investigation becomes necessary.
Hidden Killer #2: Nested Loop Join Explosions
Nested loops are among the most misunderstood execution plan operators.
In the right circumstances, nested loops are extremely efficient.
In the wrong circumstances, they become major performance bottlenecks.
A nested loop works by processing one row from the outer table and repeatedly searching matching rows in the inner table.
For small result sets, this strategy performs exceptionally well.
Problems emerge when row estimates are inaccurate.
For example:
SELECT *
FROM customers c
JOIN orders o
ON c.customer_id = o.customer_id;
If PostgreSQL estimates a few hundred matching rows but actually processes several million, the nested loop may execute millions of repetitive lookups.
The result is exponential growth in processing time.
PostgreSQL Query Execution Plans often display:
Nested Loop
followed by unexpectedly high loop counts.
Production Incident Example
An enterprise application experienced severe slowdowns after a software release.
Application response times increased from milliseconds to several seconds.
Analysis revealed a nested loop join processing nearly forty million iterations due to inaccurate statistics.
The planner expected approximately five thousand rows.
Actual execution returned over three million rows.
Updating statistics and restructuring the query immediately resolved the issue.
No hardware upgrades were required.
Why Row Estimation Errors Matter
PostgreSQL relies heavily on statistical information.
The planner cannot evaluate every possible execution strategy.
Instead, it uses mathematical estimates.
When estimates are inaccurate, poor decisions follow.
Common causes include:
Outdated statistics
Rapid data growth
Skewed data distribution
Infrequent ANALYZE operations
Complex predicates
Large differences between estimated rows and actual rows should always be investigated.
These discrepancies often explain why execution plans behave unexpectedly.
Hidden Killer #3: Outdated Statistics
Statistics are the foundation of query planning.
Without accurate statistics, PostgreSQL essentially makes educated guesses.
Over time, production systems evolve.
Tables grow.
Data distributions change.
Application behavior shifts.
Queries that once performed well begin degrading.
This often happens because planner statistics no longer reflect current conditions.
Symptoms include:
Unexpected sequential scans
Incorrect join methods
Excessive sorting operations
Increased execution times
Regular maintenance should include:
ANALYZE;
or
VACUUM ANALYZE;
Keeping statistics current enables PostgreSQL to make more informed planning decisions and improves overall execution plan quality.
Hidden Killer #4: Hash Join Memory Pressure
Hash joins are generally considered one of PostgreSQL’s most efficient join strategies for large datasets.
The planner builds an in-memory hash table from one side of the join and then uses it to quickly locate matching rows from the second table.
When enough memory is available, hash joins perform exceptionally well.
Problems begin when the hash table exceeds available memory.
Instead of remaining in memory, PostgreSQL spills data to temporary disk storage.
PostgreSQL Query Execution Plans often display:
Hash Join
Hash Cond:
At first glance, the plan appears healthy.
However, deeper investigation may reveal excessive temporary file usage and disk activity.
A Common Production Scenario
A retail analytics platform generated daily sales reports against several hundred million records.
Initially, reports completed in under ten minutes.
As transaction volumes increased, report execution times exceeded two hours.
The SQL itself had not changed.
The problem was memory pressure.
The hash table no longer fit into available work memory.
PostgreSQL began writing temporary files to disk.
Increasing work_mem for the reporting workload eliminated the spills and reduced execution times dramatically.
The PostgreSQL Query Execution Plan remained similar, but the execution behavior changed significantly.
What to Look For
Warning signs include:
Large temporary file creation
High disk I/O during query execution
Significant differences between planning time and execution time
Excessive memory utilization
Hash joins are not inherently problematic.
The issue arises when memory allocation does not align with workload requirements.
Hidden Killer #5: Sorting Operations That Spill to Disk
Sorting is another operation frequently overlooked during PostgreSQL performance investigations.
Applications often require:
ORDER BY clauses
Window functions
Aggregate operations
Reporting queries
When PostgreSQL can perform sorting in memory, performance is usually acceptable.
When available memory is insufficient, sorting spills to disk.
This creates substantial overhead.
Consider:
SELECT *
FROM customer_transactions
ORDER BY transaction_date DESC;
If millions of rows must be sorted, PostgreSQL may create temporary files to complete the operation.
The larger the dataset, the greater the impact.
Real-World Observation
A logistics company experienced recurring database slowdowns every Monday morning.
Investigation revealed a reporting process generating multiple large sorts simultaneously.
Each query individually appeared harmless.
Together they created extensive temporary file activity.
Storage latency increased.
Application performance suffered.
Adjusting memory settings and redesigning the reporting process resolved the issue without infrastructure changes.
Hidden Killer #6: Missing Composite Indexes
Many organizations understand the importance of indexes.
Far fewer understand the importance of index design.
A query may already use an index and still perform poorly.
Consider:
SELECT *
FROM orders
WHERE customer_id = 1001
AND order_status = 'OPEN';
A single-column index on customer_id may help.
However, PostgreSQL may still perform additional filtering after retrieving rows.
A composite index can often eliminate unnecessary work.
For example:
(customer_id, order_status)
This allows PostgreSQL to locate matching records more efficiently.
Why This Matters
Database teams frequently assume indexing has already been addressed.
In reality, many production environments contain:
Redundant indexes
Unused indexes
Missing composite indexes
Incorrect column order
PostgreSQL Query Execution Plan analysis frequently reveals these design issues.
The objective is not simply to add indexes.
The objective is to create indexes that support actual workload patterns.
Hidden Killer #7: Excessive Table Bloat
One of the most underestimated PostgreSQL performance problems is table bloat.
PostgreSQL uses Multi-Version Concurrency Control (MVCC) to manage transactions.
As rows are updated and deleted, dead tuples accumulate.
Without proper maintenance, tables become significantly larger than necessary.
This affects:
Sequential scans
Index scans
Cache efficiency
Vacuum performance
Storage utilization
Production Impact
A customer support platform experienced steadily increasing query response times.
Hardware utilization remained stable.
Query logic had not changed.
Investigation revealed substantial table bloat caused by years of frequent updates.
The active dataset represented less than half the physical table size.
After maintenance and optimization, query performance improved substantially.
The execution plans themselves did not change dramatically.
The amount of data PostgreSQL needed to process did.
Using EXPLAIN ANALYZE Effectively
Many teams run EXPLAIN ANALYZE but focus only on execution time.
Experienced database consultants examine additional details.
Important metrics include:
Estimated Rows vs Actual Rows
Large differences often indicate statistics problems.
Loop Counts
Unexpectedly high loop counts frequently reveal nested loop inefficiencies.
Buffer Usage
Buffer statistics help identify excessive I/O activity.
Sort Methods
Sort operations reveal whether PostgreSQL is using memory or disk.
Join Strategies
Understanding why PostgreSQL selected a particular join method often explains performance problems.
Execution plans should always be evaluated holistically rather than focusing on a single metric.
A Structured PostgreSQL Production Query Tuning Process
Successful PostgreSQL production query tuning rarely begins with rewriting SQL.
The most effective troubleshooting approach follows a systematic process.
Step 1: Identify the Slow Query
Capture:
Query text
Execution frequency
Runtime duration
Resource consumption
Step 2: Collect PostgreSQL Query Execution Plans
Run:
EXPLAIN ANALYZE
and gather execution statistics.
Step 3: Compare Estimates with Reality
Identify where planner assumptions differ from actual execution behavior.
Step 4: Review Index Strategy
Determine whether existing indexes support workload requirements.
Step 5: Validate Statistics
Confirm planner statistics reflect current data distributions.
Step 6: Analyze Memory Usage
Review sorting operations, hash joins, and temporary file generation.
Step 7: Measure Improvements
Always validate performance gains using measurable results.
This structured methodology consistently produces better outcomes than random optimization attempts.
Why PostgreSQL Performance Problems Often Go Undetected
Many production environments operate below peak capacity for extended periods.
Performance issues develop gradually.
Queries that originally executed in milliseconds begin requiring seconds.
Data volumes increase.
Business workloads expand.
New application features introduce additional complexity.
The degradation is incremental.
By the time users report slow performance, the underlying inefficiencies may have existed for months.
Regular execution plan reviews help identify emerging problems before they become production incidents.
Organizations that proactively analyze query behavior typically experience:
Fewer outages
Faster response times
Improved scalability
Better infrastructure utilization
Lower operational costs
How Pinnacle Digitech Edge Helps Organizations Optimize PostgreSQL Performance
PostgreSQL performance issues rarely stem from a single cause.
Most production incidents involve a combination of:
PostgreSQL Query Execution Plan inefficiencies
Missing indexes
Planner estimation errors
Statistics issues
Memory bottlenecks
Application workload changes
At Pinnacle Digitech Edge, our consultants help organizations investigate complex PostgreSQL performance challenges, analyze execution plans, identify root causes, and implement optimization strategies that improve reliability and scalability.
Rather than focusing solely on infrastructure upgrades, we concentrate on understanding how PostgreSQL executes workloads and where inefficiencies exist.
This approach often delivers significant performance improvements while avoiding unnecessary hardware costs.
If your team is experiencing slow queries, production performance degradation, high CPU utilization, or unexplained database bottlenecks, explore our PostgreSQL Consulting Services to learn how we can help optimize your PostgreSQL environment.
Final Thoughts
The most dangerous PostgreSQL performance issues are rarely obvious.
A query may appear simple while hiding PostgreSQL Query Execution Plan inefficiencies that consume substantial resources.
Nested loops, sequential scans, stale statistics, memory spills, sorting operations, and table bloat are among the most common hidden killers affecting production systems.
Understanding PostgreSQL Query Execution Plan Analysis provides the visibility needed to uncover these bottlenecks and resolve them before they impact business operations.
For database teams responsible for maintaining high-performance PostgreSQL environments, PostgreSQL Query Execution Plan analysis is not simply a troubleshooting technique. It is an essential discipline that supports reliability, scalability, and long-term operational success.