
PostgreSQL Optimization vs Oracle Optimization: Real-World Query Tuning for Production Bottlenecks
There is a certain kind of message that instantly changes the tone of an engineering day. It usually lands in Slack, Teams, or a war-room bridge with very little context and a lot of urgency. A payment workflow has slowed down. A customer-facing dashboard is timing out. A nightly ETL job that usually finishes before sunrise is still running at 10 a.m. The application team thinks it is the database. The infrastructure team thinks it is the application. The product team just wants to know how soon the system will recover.
That is the moment when database optimization stops being a theoretical discussion and becomes an operational problem with business consequences. In those situations, the debate around PostgreSQL optimization vs Oracle optimization becomes much more practical than philosophical. Nobody in the middle of a production incident is asking which platform has the prettier feature sheet. They want to know why the query plan changed, why a nested loop suddenly started consuming minutes instead of milliseconds, why a sequential scan is chewing through millions of rows, and how to fix it without breaking five other things in the process.
This is where real-world query tuning separates itself from generic database advice. The bottlenecks that hurt production systems are rarely caused by one dramatic mistake. More often, they come from a stack of smaller decisions that looked harmless at the time: a missing index on a fast-growing column, stale statistics after a data spike, a join that worked perfectly at 5 million rows and falls apart at 200 million, or a reporting query that quietly became part of a latency-sensitive application flow. Whether you are working in Oracle or PostgreSQL, those are the kinds of issues that cause open incidents, sleepless weekends, and a lot of uncomfortable postmortems.
This guide looks at PostgreSQL optimization vs Oracle optimization through that real-world lens. Instead of comparing features in the abstract, we are going to focus on how production bottlenecks actually appear, how query tuning differs between the two platforms, and what senior database engineers and tech leads should pay attention to when performance starts to degrade under real workload pressure.
Why PostgreSQL Optimization vs Oracle Optimization Matters in Production
When teams compare PostgreSQL Optimization vs Oracle Optimization, the conversation often gets framed around licensing, ecosystem flexibility, or migration strategy. Those are important discussions, especially for long-term architecture planning, but they do not help much when a business-critical query is already dragging down a live application. In production, the more relevant question is how each platform behaves when the optimizer chooses the wrong path, and how quickly your team can diagnose and stabilize the workload.
Oracle has decades of maturity in enterprise performance troubleshooting. The optimizer is sophisticated, the instrumentation is deep, and experienced Oracle DBAs are used to working with a rich set of performance views, wait-event data, SQL monitoring, plan history, and tuning tools. That matters when you are trying to understand whether a regression came from stale statistics, a changed execution plan, a skewed bind variable pattern, or a broader workload bottleneck somewhere else in the system.
PostgreSQL approaches the same challenge from a different operational style. It has become extremely capable, but it rewards teams that are deliberate about observability, indexing, statistics, vacuum strategy, and execution plan analysis. PostgreSQL can perform beautifully at scale, but it expects you to understand how planner estimates, storage layout, maintenance behavior, and query design all interact. In other words, PostgreSQL query tuning is not just about fixing SQL syntax. It is about building an environment where the planner has enough information to make smart decisions consistently.
That is why PostgreSQL optimization vs Oracle optimization is not really a contest over which database is “faster.” Both platforms are capable of excellent performance. The more useful comparison is how they behave under pressure, what kinds of bottlenecks show up most often, and what tuning discipline is required to keep production stable as workloads evolve.
The Production Incident Nobody Thought Was a Query Problem
A few months ago, a team reached out after a sudden performance drop in a customer-facing application. The first assumption was infrastructure saturation because CPU usage had spiked and the application servers were reporting timeouts. But once we looked deeper, the database told a different story. A query that had been harmless for months was now reading far more rows than expected because the underlying table had grown rapidly and the original access path no longer made sense. One predicate filtered on a column with no useful supporting index. Another join relied on a nested loop strategy that looked cheap in the planner’s estimate but became painfully expensive once the row counts multiplied under production traffic.
Nothing about that incident was dramatic in isolation. There was no catastrophic outage, no hardware failure, no corrupted table. It was simply a case of the workload outgrowing assumptions that had been baked into the query plan. That is exactly why real-world query tuning deserves more attention than it usually gets. Production slowdowns are often caused by the quiet accumulation of optimization debt rather than one obvious mistake.
This pattern appears in both Oracle and PostgreSQL environments. The details differ, but the underlying story is familiar. Data grows. Query frequency changes. A report becomes part of an API workflow. A filter that used to return 200 rows now returns 200,000. A join that once touched a tiny dimension table now has to navigate skewed transactional data. At that point, the database is no longer executing the workload you designed six months ago. It is executing the workload your business has become.
Sequential Scans on Unindexed Columns: The Slowdown That Looks Simple but Rarely Is
One of the most common execution bottlenecks in production systems is the sequential scan on a column that should have been indexed long ago. Sometimes the fix is straightforward. A highly selective filter is reading a massive table because there is no supporting index, and adding the right index changes the response time almost immediately. But in real systems, the story is usually more complicated.
In PostgreSQL, a sequential scan might appear because the index truly does not exist, but it can also happen when an index exists and still is not being used effectively. The planner may decide the index is not selective enough, or statistics may be stale enough that the estimated cost of using the index looks worse than scanning the table. In some cases, the query itself prevents efficient index usage because a function wraps the filtered column or the predicate shape no longer matches the index design. What looks like “just add an index” can turn into a deeper exercise in understanding selectivity, cardinality, query structure, and maintenance patterns.
Oracle environments run into the same class of problem, though the troubleshooting path can be broader. A full scan might be the result of outdated optimizer statistics, skewed histograms, plan instability, or a workload pattern that has shifted since the original SQL was written. The challenge is not simply identifying that the table is being scanned. The challenge is understanding why the optimizer thought that was acceptable, and whether changing the access path will improve the wider workload or just one query.
That distinction matters because production tuning is never only about the query in front of you. If you add an index without thinking about write overhead, maintenance cost, or concurrency effects, you can solve one problem while quietly creating another. That is why database execution bottlenecks have to be treated as workload problems, not isolated SQL events.
Nested Loop Problems: When a Reasonable Join Strategy Turns into a Disaster
Nested loops are not the villain of database tuning. In fact, they are often exactly the right choice when the outer result set is small and the inner lookup is highly selective. The trouble starts when the optimizer believes it is dealing with a tiny row set and reality says otherwise. That is when a join method that should have taken milliseconds starts executing hundreds of thousands of index lookups and turns into a full-scale production incident.
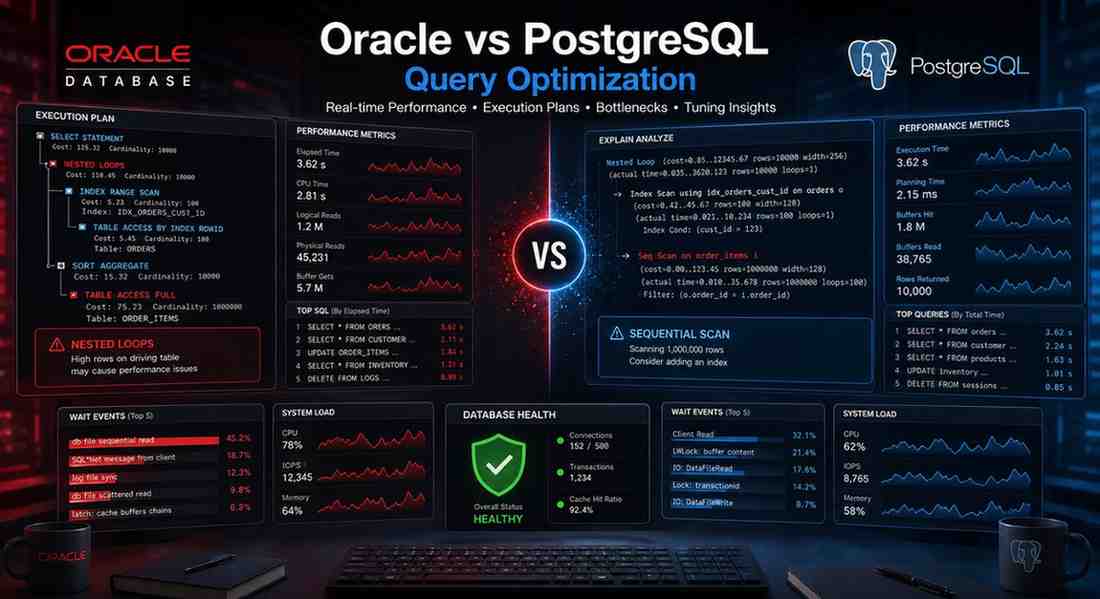
In PostgreSQL, this often shows up in EXPLAIN ANALYZE plans where the estimated row count looks small but the actual row count is dramatically higher. Once that mismatch happens, the nested loop multiplies the problem. Instead of doing a handful of targeted lookups, the engine repeats them again and again under a row volume the planner never expected. The result is slow execution, rising IO, excessive buffer churn, and in busy systems, cascading application latency.
Oracle sees the same failure pattern in different clothing. A nested loop may be selected because the optimizer expected a highly selective join path, only to discover that the data distribution has changed or that bind-sensitive execution no longer matches the original assumptions. In those situations, Oracle’s instrumentation can be extremely valuable because it helps DBAs reconstruct whether the plan changed recently, whether the estimate was wrong from the beginning, or whether a broader workload condition pushed the statement into a less efficient path.
This is one of the most practical areas where Oracle optimization vs PostgreSQL optimization becomes a real operational conversation. Oracle offers mature plan analysis and historical performance tooling, which can shorten root-cause analysis in large enterprise environments. PostgreSQL often pushes teams toward direct evidence gathering through plan analysis, statistics validation, query reshaping, and index design rather than relying on heavier plan management mechanisms. Neither approach is inherently better. They simply demand different habits from the engineering team.
The Hidden Root Cause Behind Many Slow Queries: Bad Cardinality Estimates
When a production query goes bad, the visible symptom is usually a slow response time, but the underlying cause is often an incorrect estimate made much earlier in the planning process. That estimate shapes everything that follows. It influences join order, join method, sort expectations, memory assumptions, and access path selection. Once the optimizer has the wrong picture of how many rows will flow through the plan, every downstream decision becomes vulnerable.
In PostgreSQL, poor row estimates are commonly tied to stale statistics, skewed values, correlated predicates, or data distributions that have changed faster than maintenance processes can keep up. A query that combines multiple filters may look selective on paper while actually touching a much larger slice of the table than the planner expects. When that happens, the chosen plan may be technically valid but operationally disastrous.
Oracle has the same problem in spirit, though the mechanisms can be more layered. Histograms, bind peeking behavior, evolving data patterns, and optimizer assumptions can all contribute to plan choices that no longer fit the live workload. This is why experienced Oracle performance engineers do not just stare at the final plan shape. They ask whether the optimizer’s model of the data is still trustworthy.
That question matters in both platforms because fixing the visible query without addressing the estimation problem is often temporary. You may improve performance today, only to watch the same workload fail again after the next growth cycle. Sustainable database performance tuning requires more than query rewrites. It requires making sure the optimizer understands the reality of the data it is planning against.
PostgreSQL Query Tuning in Practice: Where the Investigation Usually Starts
In PostgreSQL, the most effective tuning work usually begins with evidence, not instinct. Before changing indexes or rewriting SQL, it helps to understand which queries are truly responsible for the slowdown. A statement that takes three minutes once a day is not always the highest-priority issue. A query that takes 120 milliseconds but runs 400,000 times per hour may be far more damaging to the system overall.
Once the high-impact statements are identified, the investigation typically moves into execution plans, row estimates, buffer activity, sort behavior, and table access patterns. If a query is scanning far too many rows, the next question is whether the problem is index design, predicate shape, stale statistics, or a broader modeling issue. If a join is looping excessively, the focus shifts to whether the planner misjudged cardinality, whether a composite index is missing, or whether the query itself is encouraging a bad join path.
This is also where PostgreSQL forces teams to think holistically. A slow query may not just be a SQL problem. It may be a vacuum problem. It may be table bloat. It may be poor autovacuum settings on a write-heavy table. It may be an architecture issue where a reporting pattern has been mixed into a latency-sensitive transactional flow. PostgreSQL database optimization works best when engineers treat execution plans, indexing, maintenance, and workload design as parts of the same system rather than isolated checkboxes.
For teams dealing with recurring production slowdowns in PostgreSQL, the most valuable work is often not a one-time fix. It is building a repeatable process for identifying query regressions, validating plan quality, and preventing table growth or statistics drift from silently undermining performance. That is exactly the kind of work supported by Pinnacle Digitech Edge’s PostgreSQL Performance Tuning Services and PostgreSQL Query Optimization Services, especially in environments where the line between “application issue” and “database issue” has already blurred.
PostgreSQL performance tuning documentation
Oracle Query Tuning in Practice: More Instrumentation, More Context, Higher Stakes
Oracle production environments often come with more operational history and more layers of enterprise dependency. It is common to see Oracle workloads supporting ERP systems, financial processing, regulatory reporting, healthcare applications, or heavily customized line-of-business platforms. That means tuning an Oracle query is rarely just about making one statement faster. It is about stabilizing a workload that may be tied to batch windows, vendor code, compliance deadlines, and application teams who do not want the database touched unless absolutely necessary.
The advantage is that Oracle gives experienced DBAs a mature toolbox for investigating what went wrong. Historical SQL behavior, wait-event analysis, plan changes, memory pressure, concurrency patterns, and workload shifts can all be examined in a structured way. The challenge is deciding which evidence matters most when the incident window is active and business pressure is building.
Oracle query tuning often becomes a balancing act between SQL rewrite opportunities, indexing strategy, optimizer statistics quality, and execution-plan stability. In some cases, the right answer is to rewrite a statement that has become overly expensive under modern data volume. In others, the better move is to address plan regression, refresh statistics intelligently, or restore a more stable access path. That is why Oracle database optimization is rarely a one-dimensional exercise. The technical fix has to fit the operational environment around it.
For organizations that rely heavily on Oracle for core workloads, this is where specialized support becomes valuable. A performance incident on a finance platform or business-critical reporting environment is not the place for trial-and-error tuning. Teams need a disciplined approach to plan analysis, workload diagnostics, and risk-aware remediation. Pinnacle Digitech Edge supports that kind of work through Oracle Performance Tuning Services, Oracle Database Consulting Services, and Oracle Production Support Services, especially when the goal is not just to speed up one query but to stabilize the broader production environment.
Why “Just Add an Index” Is Not a Real Optimization Strategy
It is easy to understand why indexing becomes the first instinct in performance troubleshooting. Sometimes it works beautifully. A missing index on a frequently filtered column is identified, the index is added, and the response time drops from minutes to milliseconds. Everyone feels relieved, and the incident moves toward closure. The danger is assuming that indexing is always the right answer simply because it worked once.
Indexes have a cost in both PostgreSQL and Oracle. They increase storage usage, add maintenance overhead, affect write performance, and can complicate long-term workload behavior if they are added reactively rather than designed thoughtfully. A new index might rescue one report while slowing inserts and updates across a high-volume transactional table. It might help one filter condition but still leave a join pattern inefficient because the real issue was join order or cardinality, not access path alone.
The better question is not whether a query needs an index, but whether the workload needs a different access strategy. Is the problem a single-column filter, or is the query actually crying out for a composite index aligned with its join and sort pattern? Is the table so bloated that even a reasonable index scan is now more expensive than expected? Is the application issuing a query shape that should be rewritten rather than patched with another structure?
This is where senior database teams and performance consultants create the most value. They resist the urge to tune by reflex. Instead, they look at how the query fits the broader workload, how the table is used across the system, and whether the proposed change still makes sense six months from now when data volume has doubled again.
Full Scans, Hash Joins, and Other Things People Blame Too Quickly
One of the fastest ways to make a production tuning session unproductive is to turn every operator in an execution plan into a villain. Full table scans are not always bad. Hash joins are not always better than nested loops. Sort operations are not always evidence of failure. The database is not trying to sabotage you. It is making a cost-based decision using the information it has.
A full scan on a small table can be perfectly reasonable. A hash join can outperform a nested loop dramatically when the join inputs are large enough. A sort can be unavoidable if the query genuinely needs ordered output and no access path already provides it. The real problem is not that these operators exist. The real problem is when they appear in places where they no longer fit the workload reality.
That is why execution plan analysis for production has to go beyond spotting scary operators. It requires asking better questions. Why is the database reading this many rows in the first place? Why did the planner believe this path was selective? Why is the join happening in this order? Why are rows being widened early and filtered late? Why is a statement that used to be fast now choosing a different plan?
Those are the questions that lead to durable fixes. They move the conversation away from “this operator looks bad” and toward “this plan no longer matches the workload.” That distinction is where real slow query troubleshooting begins.
PostgreSQL Optimization vs Oracle Optimization for Teams Handling Live Incidents
If your team is actively dealing with production slowdowns, the choice between Oracle and PostgreSQL is less about ideology and more about operating model. Oracle often shines in environments that need mature enterprise instrumentation, deep historical visibility, and structured plan analysis around complex workloads. PostgreSQL shines in teams that want flexibility, strong performance, architectural freedom, and a tuning culture built around direct plan inspection, thoughtful indexing, and disciplined maintenance.
But neither platform protects you from neglect. If statistics are stale, query design is careless, indexing is reactive, and nobody is watching execution behavior as data grows, both Oracle and PostgreSQL will eventually make that debt painfully visible. That is the common thread across most performance incidents. The engine matters, but operational discipline matters more.
For that reason, PostgreSQL optimization vs Oracle optimization should not be framed as a search for a winner. It should be framed as a decision about fit. What kind of workloads do you run? How much observability do you have today? Does your team have the skills to interpret execution plans under pressure? Are you dealing with one-off slow queries or recurring production instability? Do you need support for migrations, high availability, or ongoing production performance governance in addition to query tuning?
Those questions are often more important than the platform itself, because the best database choice on paper can still become a performance liability if the organization does not have a strong optimization discipline around it.
Building a Better Incident Response Process for Database Performance
The strongest database teams do not treat query tuning as a random act of heroics. They treat it as a repeatable incident-response capability. When a production slowdown appears, they do not immediately jump to hardware upgrades, blind index creation, or application blame. They identify the highest-impact SQL, gather evidence from execution plans and runtime behavior, compare estimated and actual row counts, inspect access paths, validate statistics quality, and look for signs that the workload has outgrown earlier assumptions.
That process matters because the biggest risk in a performance incident is not just slowness. It is uncertainty. Once nobody is sure whether the root cause is indexing, plan regression, cardinality drift, concurrency, or application behavior, the temptation to make risky changes increases. That is when production fixes become guesswork, and guesswork is expensive.
A disciplined response does the opposite. It narrows the problem, validates the evidence, and makes it possible to apply the smallest effective fix with confidence. Sometimes that fix is an index. Sometimes it is a query rewrite. Sometimes it is a statistics correction, a plan stabilization step, a partitioning discussion, or a broader architecture adjustment. The point is not the tool. The point is understanding why the current execution path failed and how to correct it without destabilizing the rest of the system.
Final Thoughts: The Best Database Optimization Work Happens Before the Next Incident
There is a reason senior database engineers become so focused on execution plans, statistics, and workload patterns. Once you have lived through enough production slowdowns, you realize that the painful part is rarely the SQL alone. It is the surprise. It is the fact that a query nobody worried about six months ago is now the reason customers cannot complete a workflow. It is the discovery that a harmless reporting statement has turned into a full-table scan monster because nobody revisited its access path as the data grew.
That is why the best database optimization strategy is not just reactive tuning after something breaks. It is proactive workload review, ongoing query analysis, thoughtful indexing, statistics hygiene, and architecture decisions that reflect how the application is actually evolving. Oracle and PostgreSQL both reward that discipline. They also both punish its absence.
So when people ask about PostgreSQL optimization vs Oracle optimization, the answer is not simply which engine is faster or which optimizer is smarter. The more honest answer is that both platforms are powerful, both can support demanding enterprise workloads, and both require careful tuning once the workload becomes serious. The difference is how your team approaches that responsibility, how quickly it can diagnose plan failures, and whether you have the right expertise available when performance stops being a background concern and becomes a business risk.
If your team is facing slow queries, unstable execution plans, nested loop explosions, sequential scans on high-growth tables, or recurring production incidents, Pinnacle Digitech Edge can help. We work with engineering teams to diagnose and optimize Oracle and PostgreSQL environments through production-focused tuning, execution-plan analysis, architecture review, and database support services. If you want to reduce performance firefighting and build a more stable optimization strategy, explore our Oracle Database Consulting Services, Oracle Performance Tuning Services, PostgreSQL Performance Tuning Services, and PostgreSQL Query Optimization Services to see how we support production-critical database workloads.
FAQ
What does PostgreSQL optimization vs Oracle optimization actually mean?
PostgreSQL optimization vs Oracle optimization refers to the comparison between how PostgreSQL and Oracle databases are tuned for better query speed, execution efficiency, indexing performance, and workload stability. In practical terms, PostgreSQL optimization vs Oracle optimization is about understanding how each database handles execution plans, statistics, join strategies, memory usage, and production bottlenecks so teams can choose the right tuning approach for their environment.
Which is better in PostgreSQL optimization vs Oracle optimization for query tuning?
The answer depends on the workload, team expertise, and business requirements. In PostgreSQL optimization vs Oracle optimization, Oracle is often preferred by enterprises that need advanced monitoring, mature optimizer controls, and deep historical performance visibility. PostgreSQL is often chosen by engineering teams that want flexibility, open-source scalability, and more control over architecture and tuning. So when evaluating PostgreSQL optimization vs Oracle optimization, the right platform is usually the one that best fits the production workload and operational model.
Why is PostgreSQL optimization vs Oracle optimization important for production incidents?
PostgreSQL optimization vs Oracle optimization becomes especially important during production incidents because both platforms respond differently to slow queries, plan regressions, nested loop issues, and high-IO execution paths. When an application starts timing out or a report suddenly takes ten times longer to run, understanding PostgreSQL optimization vs Oracle optimization helps database teams diagnose whether the problem is caused by stale statistics, missing indexes, bad join order, or execution-plan instability.
How does PostgreSQL optimization vs Oracle optimization affect execution plans?
One of the biggest differences in PostgreSQL optimization vs Oracle optimization is how execution plans are generated, interpreted, and stabilized. PostgreSQL relies heavily on planner estimates, statistics, indexing, and tools like EXPLAIN ANALYZE, while Oracle provides deeper historical plan visibility, SQL monitoring, and mature optimizer diagnostics. Because of that, PostgreSQL optimization vs Oracle optimization often shapes how DBAs approach plan analysis, root-cause investigation, and long-term performance tuning.
Why do nested loops matter in PostgreSQL optimization vs Oracle optimization?
Nested loops matter because they can either be highly efficient or extremely expensive depending on row volume and join selectivity. In PostgreSQL optimization vs Oracle optimization, nested loop issues often appear when the optimizer underestimates row counts and repeatedly probes the inner table far more times than expected. That is why PostgreSQL optimization vs Oracle optimization is not just about comparing databases at a high level, but about understanding how each engine handles real-world join strategies under production load.
How do sequential scans impact PostgreSQL optimization vs Oracle optimization?
Sequential scans can become a major source of slow performance when a database reads an entire table instead of using an efficient index path. In the context of PostgreSQL optimization vs Oracle optimization, sequential scans are often investigated differently because PostgreSQL and Oracle use different optimizer logic, statistics models, and access path decisions. For teams working through PostgreSQL optimization vs Oracle optimization, sequential scan analysis is one of the most important parts of troubleshooting slow production queries.
How do stale statistics affect PostgreSQL optimization vs Oracle optimization?
Statistics are critical because both PostgreSQL and Oracle use them to estimate row counts, choose join methods, and decide whether an index scan or full scan makes sense. In PostgreSQL optimization vs Oracle optimization, stale statistics can lead to poor cardinality estimates, wrong join orders, unnecessary nested loops, and unstable execution plans. This is one of the biggest reasons PostgreSQL optimization vs Oracle optimization matters for production database health, especially in fast-growing transactional systems.
When should a company invest in PostgreSQL optimization vs Oracle optimization services?
A company should invest in database tuning services when it starts seeing recurring slow queries, execution-plan instability, long-running reports, high CPU consumption, excessive sequential scans, or user-facing latency tied to the database layer. In those situations, PostgreSQL optimization vs Oracle optimization becomes a business decision as much as a technical one, because the wrong tuning strategy can affect uptime, user experience, and operational cost. If a team is struggling to diagnose performance issues internally, external experts in PostgreSQL optimization vs Oracle optimization can help shorten incident resolution time and improve long-term database stability.
Can Pinnacle Digitech Edge help with PostgreSQL optimization vs Oracle optimization?
Yes. Pinnacle Digitech Edge helps businesses improve Oracle and PostgreSQL performance by diagnosing slow queries, fixing execution bottlenecks, resolving nested loop and sequential scan issues, improving indexing strategies, and stabilizing production workloads. If your organization needs expert support for PostgreSQL optimization vs Oracle optimization, Pinnacle Digitech Edge can assist with database consulting, query tuning, production support, architecture review, migration planning, and broader performance optimization across both Oracle and PostgreSQL environments.